


Here is the translated article in English while maintaining the original structure:
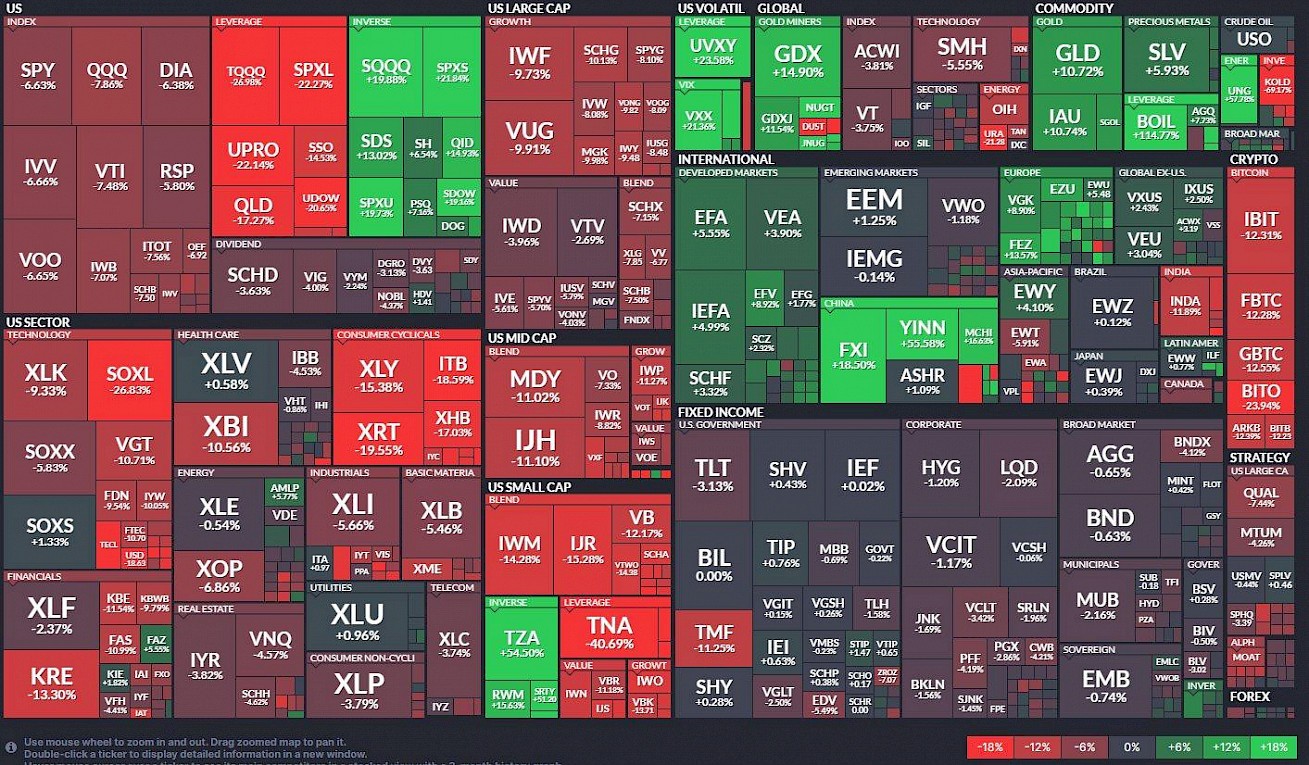
U.S. stock indexes have seen significant declines in recent days. The S&P 500 has dropped 10%, the Nasdaq 11%, and the Dow Jones 3.6% from their all-time highs.
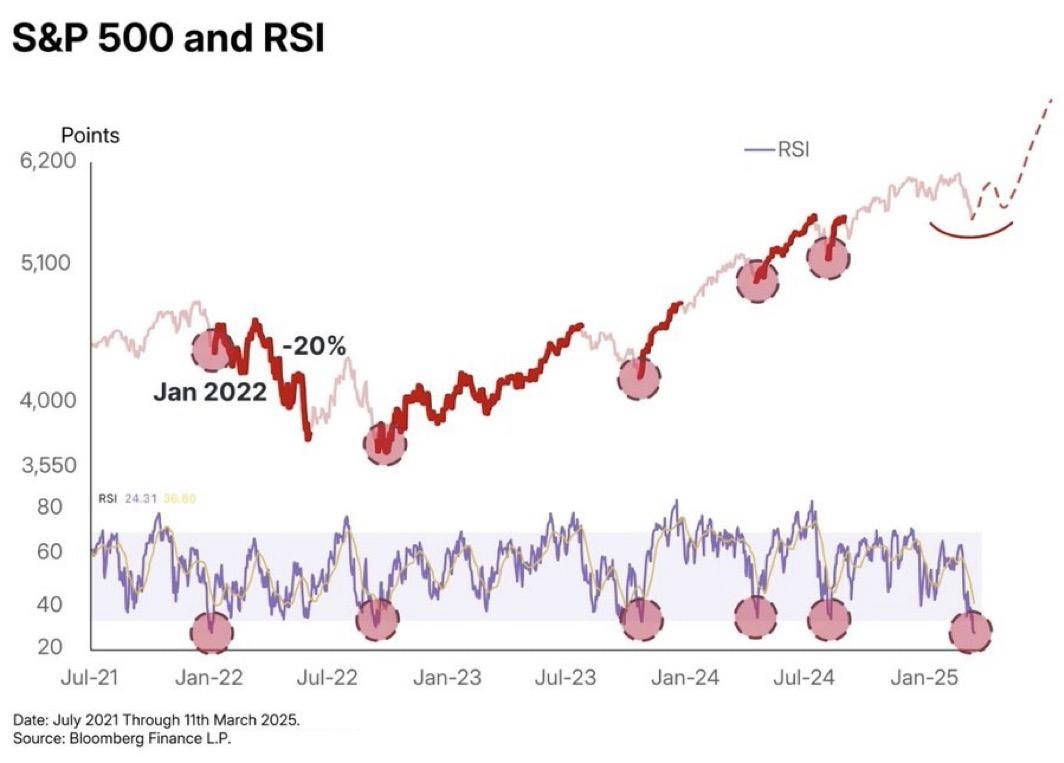
This means we are now in a technical correction, a normal market phenomenon that does not necessarily indicate a long-term problem. However, what is particularly interesting is the speed of this decline – historically, this is the fifth fastest correction ever.
A debate immediately erupted over what caused this drop. The number one suspect? Trump and his tariffs. But is that really the case?
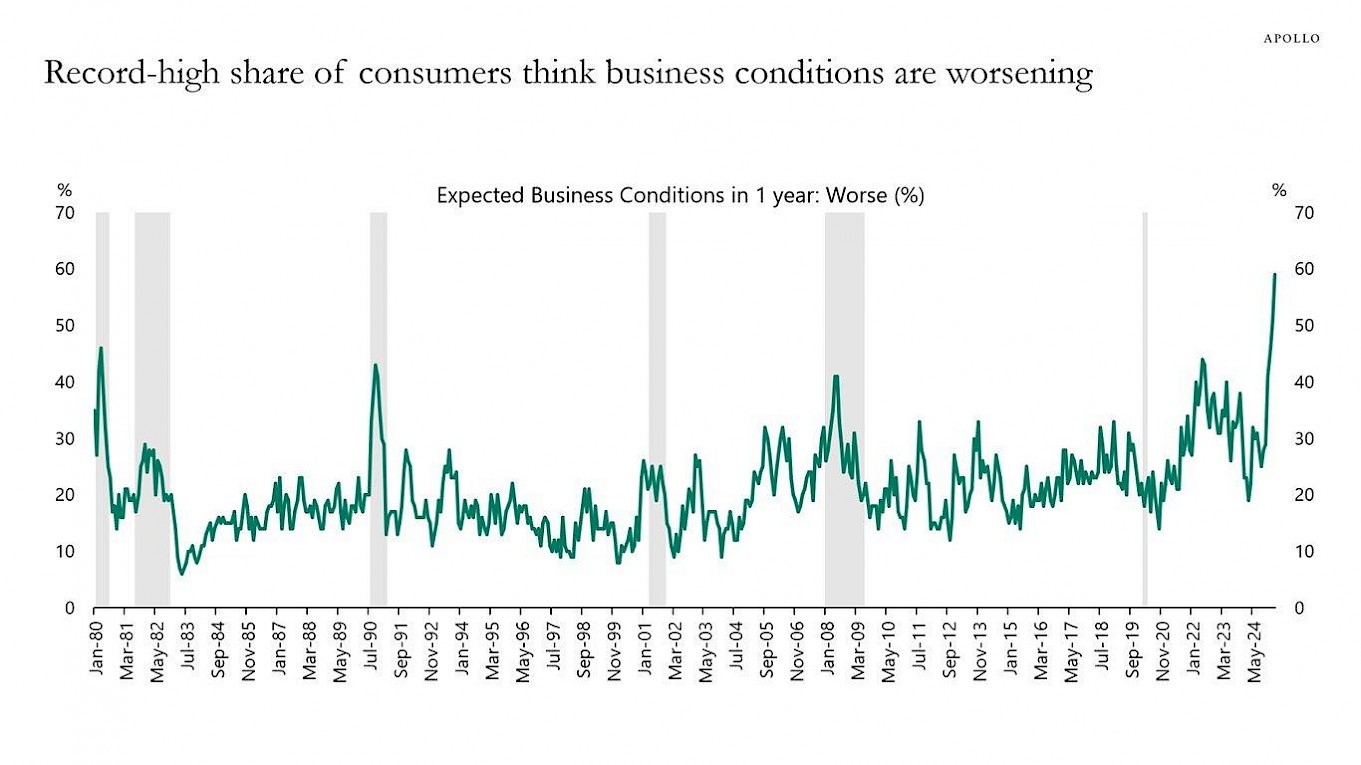
While stock markets are volatile, consumer expectations suggest even bigger problems. The index measuring expected unemployment for the next year is at its highest level since 2008.
This is a warning sign, as historically, when people begin expecting worsening economic conditions, those fears often become reality. If consumers spend less, companies cut investments and start laying off workers, potentially leading to a negative economic spiral.
It’s not reality yet, but this signal must be taken seriously.
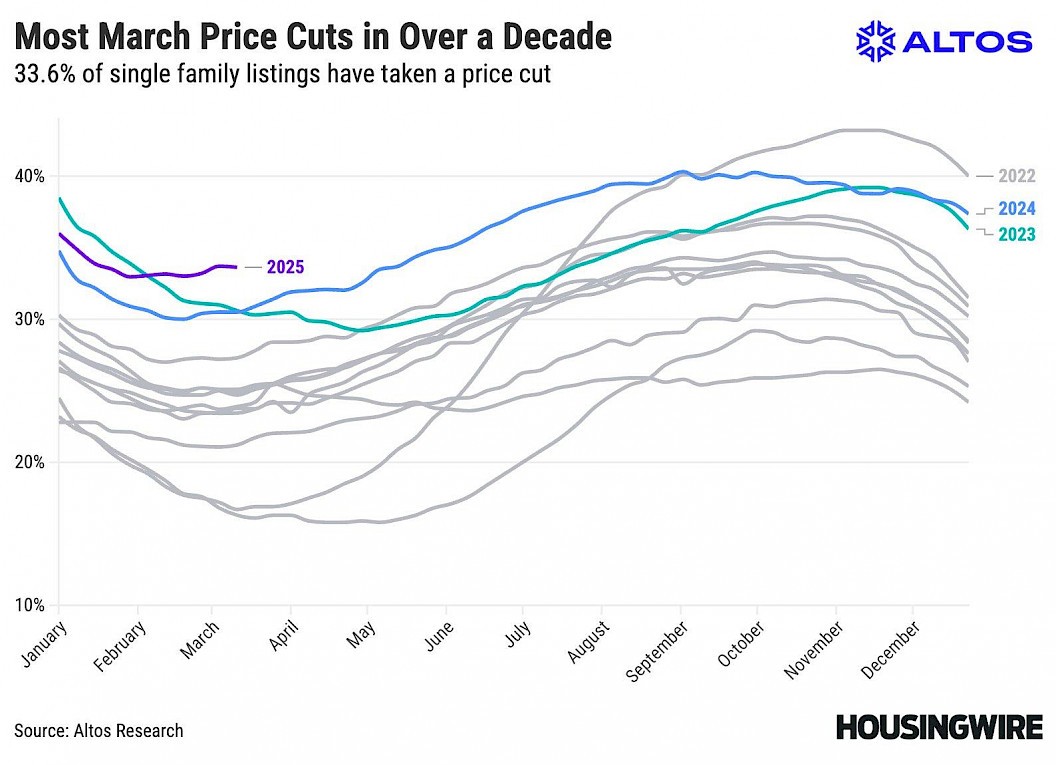
While stock markets are experiencing a correction, the real estate market is facing a different problem – buyers are unwilling to pay current high prices.
It’s not a housing market crash, but it’s a clear signal of a slowdown.
If you follow market commentary, you've likely noticed that most economic headlines focus on Trump's tariffs and geopolitical tensions. While trade wars and tariffs can impact investor sentiment, they are not the sole or primary reason for the current decline.
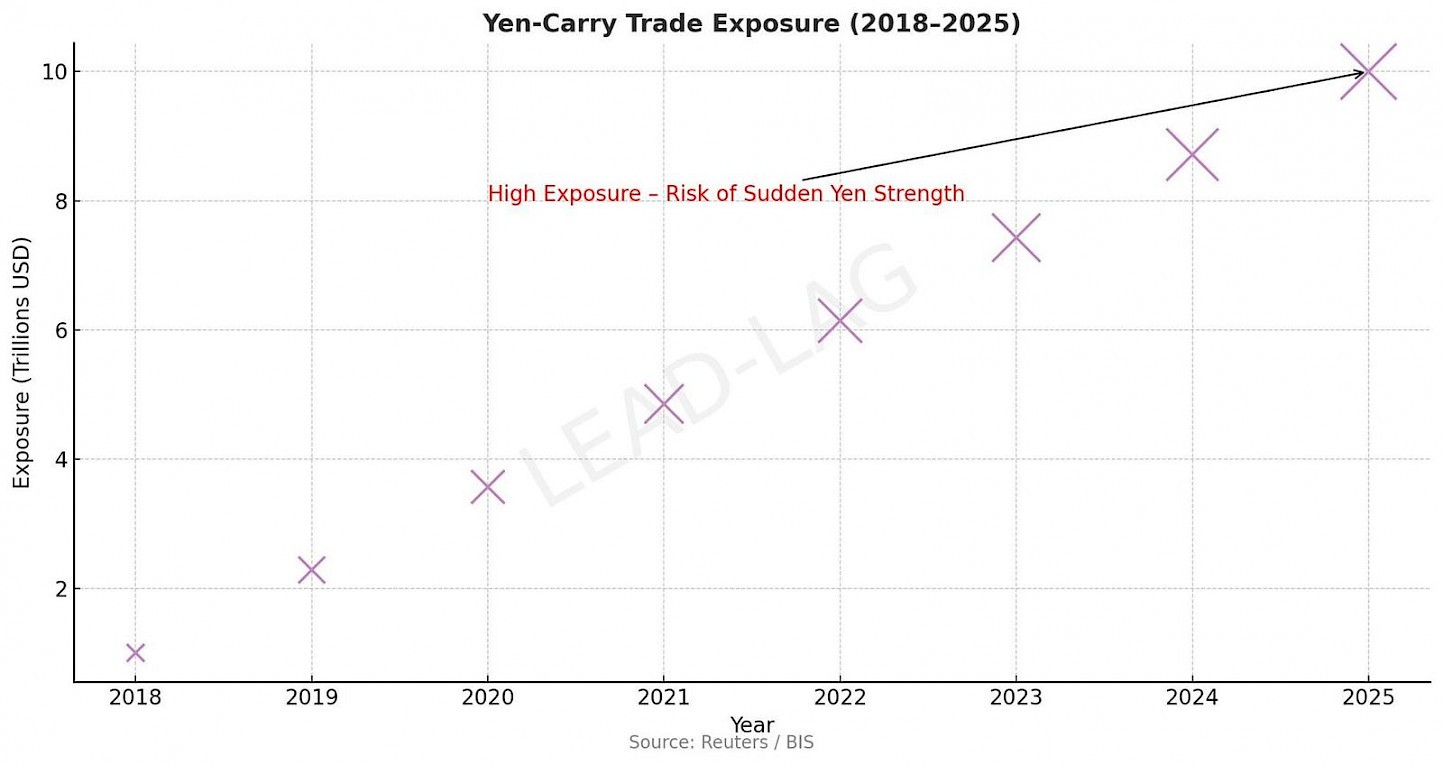
A deeper look shows that something else is at play – the unwinding of Carry Trade 2.0.
For years, cheap money created the perfect conditions for massive speculative trades funded by low-interest-rate Japanese yen. Investors borrowed in yen at near-zero rates and funneled those funds into risk assets, including U.S. stocks.
But now, the situation is changing. The Bank of Japan has hinted at a policy shift, which could unwind this massive trade. When the market suddenly has to adjust to new conditions, we see exactly what is happening now – a rapid correction that looks scary but is not catastrophic yet.
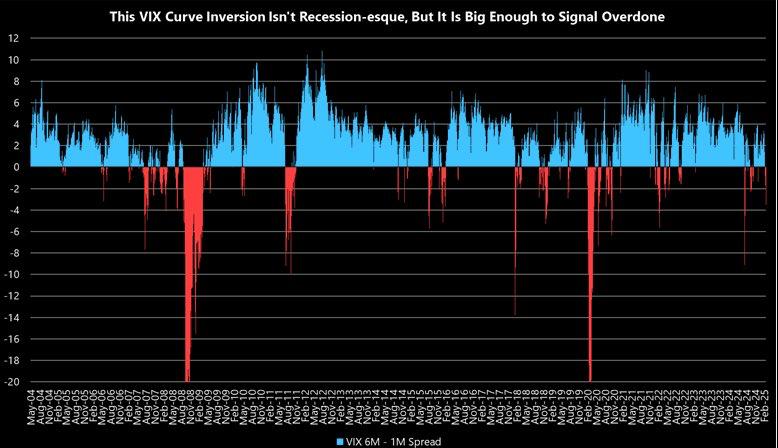
Looking at the VIX curve, which measures the difference between short-term and long-term volatility, we see that when short-term volatility exceeds long-term volatility, the market is nervous and expects turbulence.
Currently, VIX signals stress, but not a recession. There is no mass panic, rather short-term selling and profit-taking. This suggests that if the situation stabilizes, the market has a strong chance of rebounding to new highs.
If the situation deteriorates further, the Federal Reserve (FED) still has tools at its disposal:
Simply put, while we see a correction, it is not a situation without solutions.
Yes, the recent market developments are unpleasant. Indexes have fallen into technical correction, market sentiment is mixed, and volatility has increased.
But upon closer inspection, we do not see mass panic yet, and indicators such as VIX suggest this could be a short-term volatility event rather than a prolonged downturn.
Moreover, the FED still holds strong policy tools, and if needed, it can step in to provide support.
Markets are not a one-way street, and history shows that after sharp corrections, strong recoveries often follow.
This article is for informational purposes only and does not constitute investment advice. Investing in financial markets carries risks, and it is important to conduct your own analysis before making any investment decisions.