

The World at a Crossroads: Sharp Selloff, Geopolitics, and Historical Parallels
Equity markets experienced one of the sharpest corrections in recent decades during the first week of April. The S&P 500 fell more than 12% over just three trading sessions, placing it among the most severe short-term declines of the past 70 years. The Nasdaq Composite has dropped more than 20% year-to-date, falling deep into official bear market territory.
The key question isn’t what happened — but what’s happening beneath the surface.
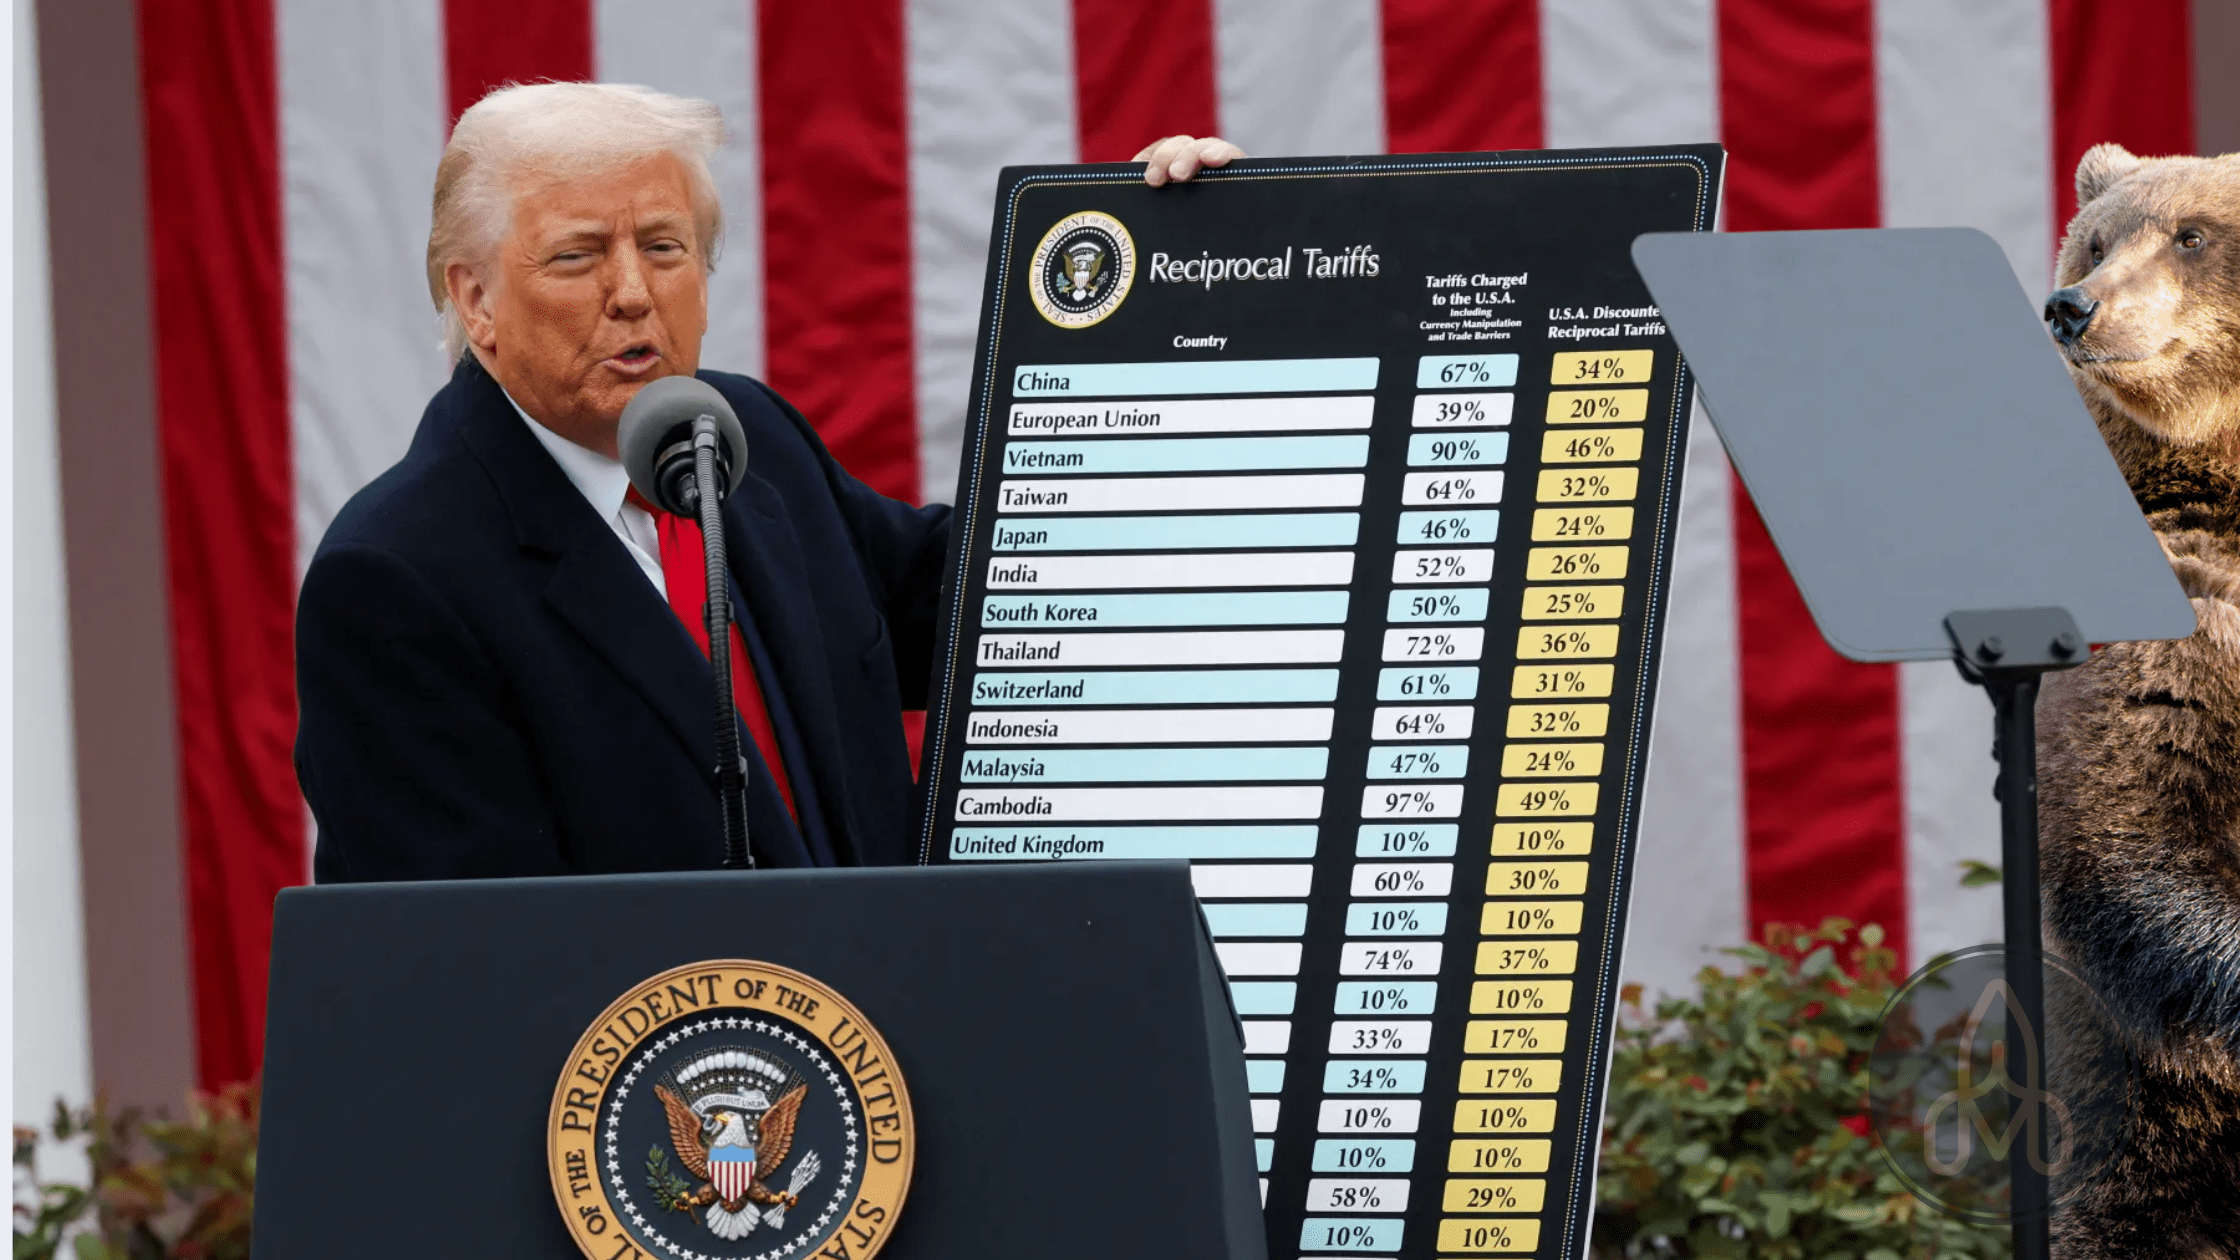
This official chart compares tariffs imposed by foreign countries on U.S. goods with the newly proposed “reciprocal” U.S. tariffs. It highlights wide discrepancies—e.g., Vietnam imposes 90% tariffs on U.S. goods, while the U.S. will reciprocate with 46%; China 67% vs. 34%. The chart underscores the administration’s justification for aggressive trade measures based on tariff imbalances.
Source: U.S. Government (Trump administration – campaign communication)
The Catalyst: Tariffs. But the Cause Runs Deeper
Extraordinary Scope and Scale of Tariffs
The Trump administration announced a new wave of tariffs, including a flat 10% on all imports, with specific items facing rates well above 25%. In certain categories — such as steel, electronics, and components from Asia and Latin America — effective tariffs reached as high as 60%, and in extreme cases, even 90% under the new methodology. This represents a deliberate systemic disruption of global supply chains, far exceeding the scope of past trade measures.
Controversial Calculation Methodology
The method is based on “reciprocal logic” and bilateral trade deficits, often leading to exaggerated estimates of trade imbalances and confusion among partners. Think tanks like AEI point out that the methodology can result in tariff rates four times higher than justified. Critics also highlight a lack of transparency and coordination, increasing uncertainty for investors.
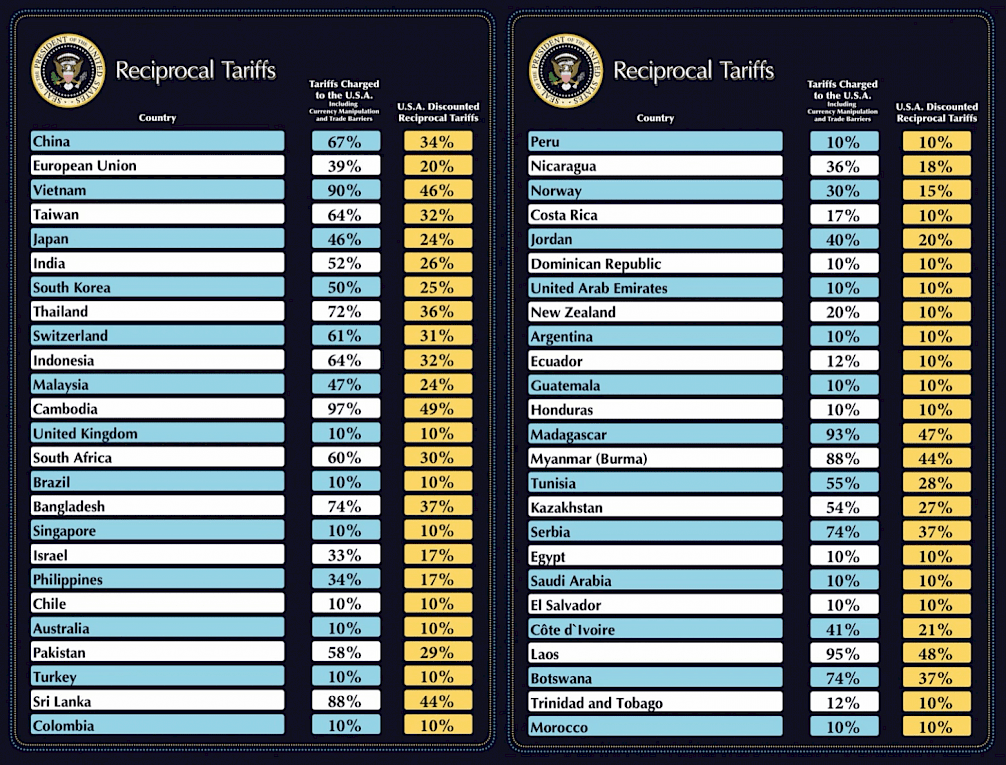
Tariff Comparisons Between the U.S. and Its Partners
The so-called “Reciprocal Tariffs” chart shows how different countries tax U.S. imports versus how the U.S. is now responding — for instance: China 67% vs. U.S. 34%, EU 39% vs. 20%, Vietnam 90% vs. 46%, and so on. While these comparisons support a more aggressive U.S. stance, they also add pressure to an already fragile global trade environment. The disparities often reflect different tax structures rather than deliberate imbalances.
Tariffs as a Catalyst, Not the Root Cause
Tariffs were not the core reason for the selloff — they were the spark. Markets were braced for some form of trade action, but not on this scale or speed. What started as speculation turned into sweeping protectionism. Beneath the surface, however, tension had been building for months. Tariffs merely ignited the volatility.
Global Response and Room for Negotiation
The Trump administration reported that more than 50 countries had already reached out to negotiate trade deals with the U.S. This signals not only confrontation but also potential realignment. The strength of tariffs as a tool lies not only in their rates, but in how selectively they are applied — offering exemptions, bartering for concessions, and linking trade policy to broader geopolitical strategy.
Response of Key Geopolitical Rivals
The European Union announced the implementation of retaliatory tariffs on U.S. goods worth €26 billion. Following Monday’s negotiations in Brussels, it was clarified that the tariffs would primarily apply to:
agricultural products,
automobile components,
high-value industrial equipment.
The implementation will take place in two phases — the first wave comes into effect on April 13, 2025, and the second will be triggered following a review of the U.S. response. The European Commission also announced the creation of a special task force to monitor the impact of these measures on the internal market and consumers. The main objective is to pressure the U.S. to return to the negotiating table and achieve more balanced trade terms.
Subsequently, and in contrast to rising trade tensions, the EU proposed a surprising alternative: to establish a zero-tariff regime for mutual trade with the United States. This proposal was officially presented by European Commission President Ursula von der Leyen during a speech in Brussels, where she called for maintaining “an open and fair trade system among key partners.”
Interestingly, a similar idea was independently supported by Elon Musk, who has repeatedly advocated for the global elimination of tariffs to improve supply chain efficiency and reduce the spread of protectionism.
The United States responded coolly. A spokesperson for the U.S. Trade Representative stated that “the proposal in its current form is insufficient,” as it fails to address structural imbalances in market access, state subsidies, and the protection of intellectual property rights.
Sources on the U.S. side have indicated a willingness to negotiate — but only if counterparts agree to stricter enforcement mechanisms and broader market access in areas such as digital services, technology, and agricultural products.
China responded by imposing an additional 34% tariff on all imports from the U.S., effective April 10, 2025. The measures were later expanded to cover:
high-tech components,
medical equipment,
agricultural commodities.
As part of the response package, China is also reviewing export licenses for U.S. companies operating in advanced materials and energy sectors. Additionally, Beijing plans to:
suspend import licenses for selected American companies,
restrict exports of strategic resources (e.g., rare earth metals),
offer selective exemptions for firms relocating production to Chinese provinces.
Beijing described these steps as “proportional to the scale of U.S. actions” while also signaling willingness to negotiate, provided the U.S. adjusts its approach.
On Wednesday, Donald Trump announced a 90-day pause on new tariffs for most countries, but took the opposite approach with China — not only maintaining existing tariffs but raising them to 125%. This move was intended to send a clear message: China would not be granted an exemption without significant concessions.
China responded swiftly by raising its retaliatory tariffs on U.S. goods to 84%, marking a substantial escalation from previous levels. At the same time, Beijing reiterated its readiness to negotiate, but only on the basis of mutual respect and equality. It emphasized that pressure tactics, threats, and unilateral moves would not lead to progress.
These developments triggered renewed volatility in financial markets — following a brief rally spurred by the “pause,” investor optimism gave way to caution as the U.S.–China trade conflict entered a more intense phase.
Fiscal Backdrop: Trump’s Pressure on the Fed and the U.S. Deficit
The administration’s protectionism is a means to an end. With the U.S. deficit projected to exceed $2 trillion this year, the current path is unsustainable. Tax hikes are politically unviable, and spending cuts are off the table for now.
Instead, a more indirect maneuver is in play: trigger enough volatility to compel the Fed to cut rates. Trump’s approach appears to be a calculated disruption aimed at monetary easing. This isn’t chaos — it’s strategic pressure.
Panic in the Market: USDJPY, Yield Curves, and Leverage Unwinding
The initial move came in the USD/JPY pair. The yen surged, and Japanese bond yields dropped, signaling a collapse in the carry trade. Hedge funds began unwinding positions en masse.
This is confirmed by record-low global long/short ratios. Japan’s monetary policies have long fueled cheap capital flows into global tech — and with tech being the most leveraged beneficiary, its stocks were hit hard. As the yen strengthened, tech exposure was slashed in parallel, amplifying the correction.
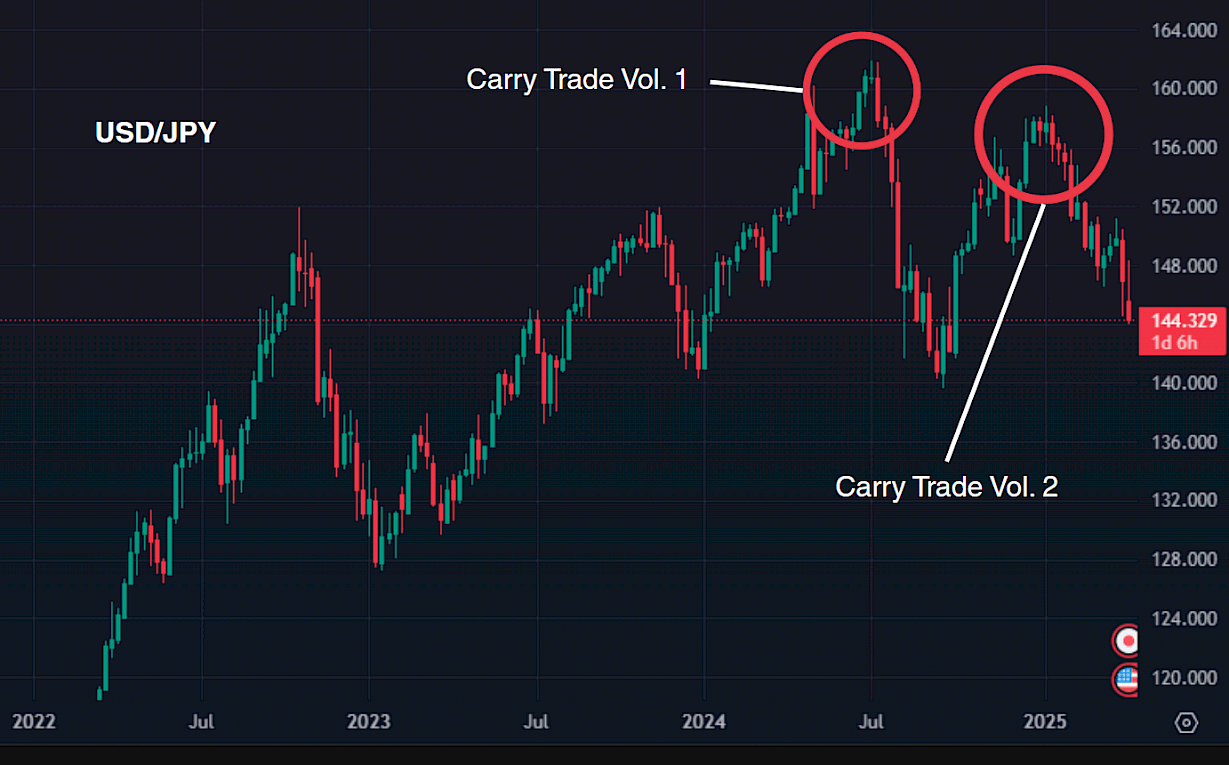
This chart of the USD/JPY exchange rate illustrates two major phases of carry trade unwinding ("Carry Trade Vol. 1" and "Vol. 2"), each followed by a sharp reversal. Both episodes correlate with broader deleveraging phases in global markets, especially within tech stocks, as leveraged positions funded through cheap yen were rapidly closed.
Interpretation: Strengthening JPY signals carry trade exits, amplifying equity selloffs.
Historical Parallel: VIX Above 45 and What Follows
There have been 21 weeks in which the VIX closed above 45. In nearly all of those cases, markets rebounded strongly:
Even within 1–2 weeks of such peaks, markets historically rebound 75% of the time. That suggests room for optimism — even at the height of fear.
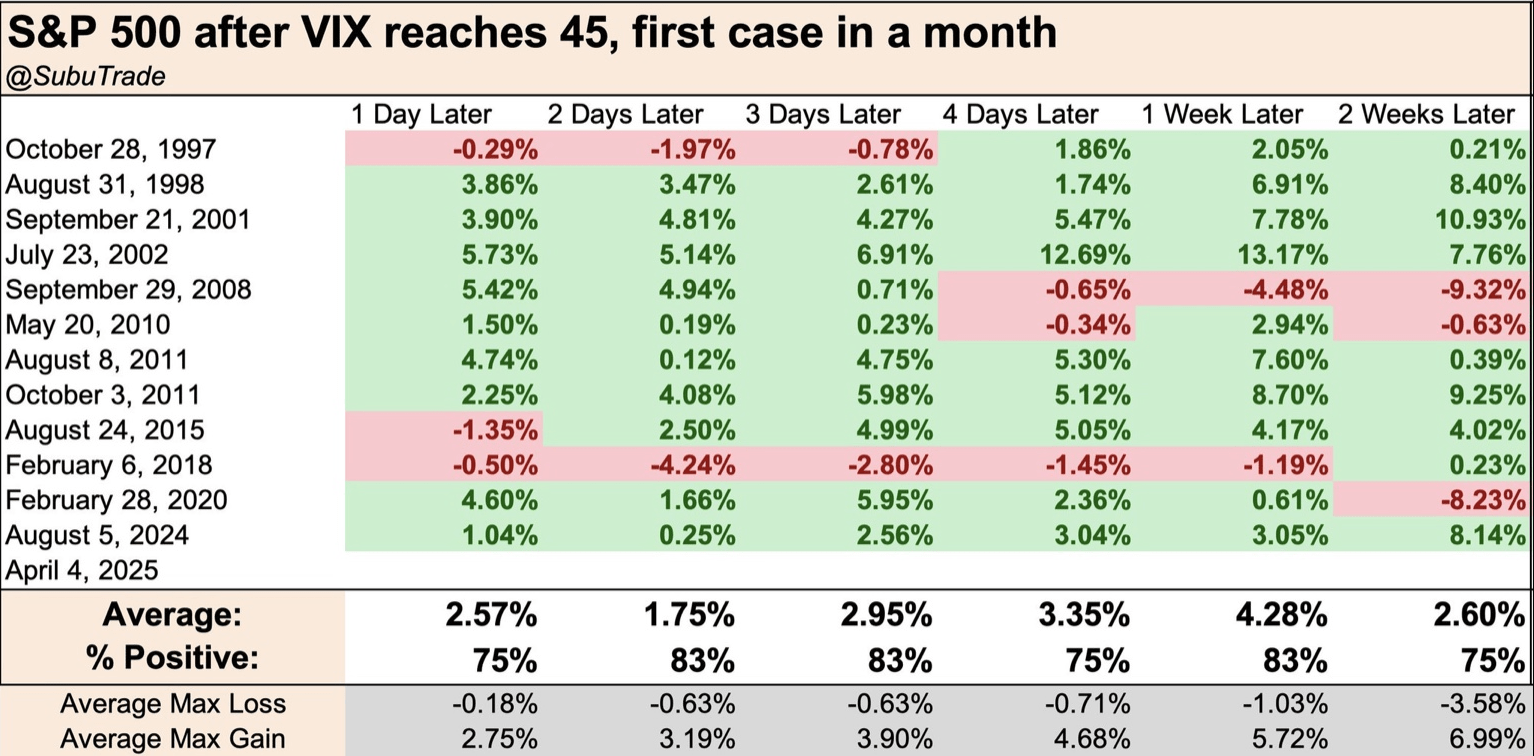
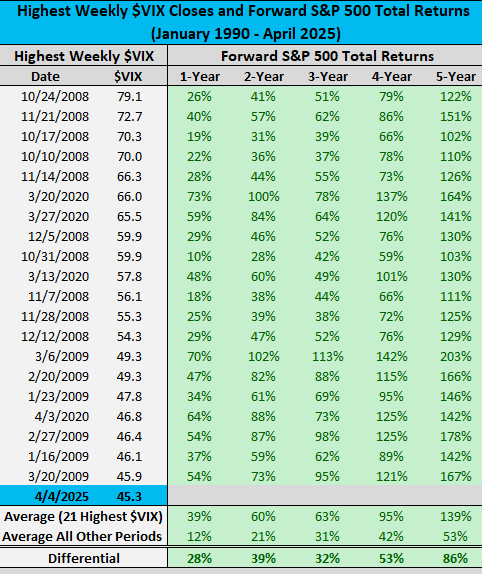
This table from Charlie Bilello shows that when the VIX closes above 45 (21 historical occurrences since 1990), the S&P 500 tends to generate strong forward returns:
+39% after 1 year
+95% after 3 years
+139% after 5 years
Compared to other periods, the post-panic returns are significantly higher.
Source: Charlie Bilello, Creative Planning
Recent Swings: A High-Stakes Game
On Monday, rumors circulated that the U.S. might pause tariffs for 90 days. The S&P 500 immediately jumped more than 7% from its intraday low — only to fall back when the report was denied. Prices then consolidated at key support.
By Wednesday, the White House made the tariff pause official. Markets soared, marking the best single-day performance since 2008. Adding to the drama, Trump posted “Now it’s the best time to buy” roughly 30 minutes before the announcement.
Our Position: Active Management in Practice
This environment has certainly affected our portfolio — but we remain ahead of major indices. It’s a testament to the value of active management, especially in times of stress.
The combination of high volume and deep selloffs points to a capitulation phase. Historically, these periods are followed by strong rallies.
In response, we:
This agility enables us to respond strategically and outperform the benchmarks over time.
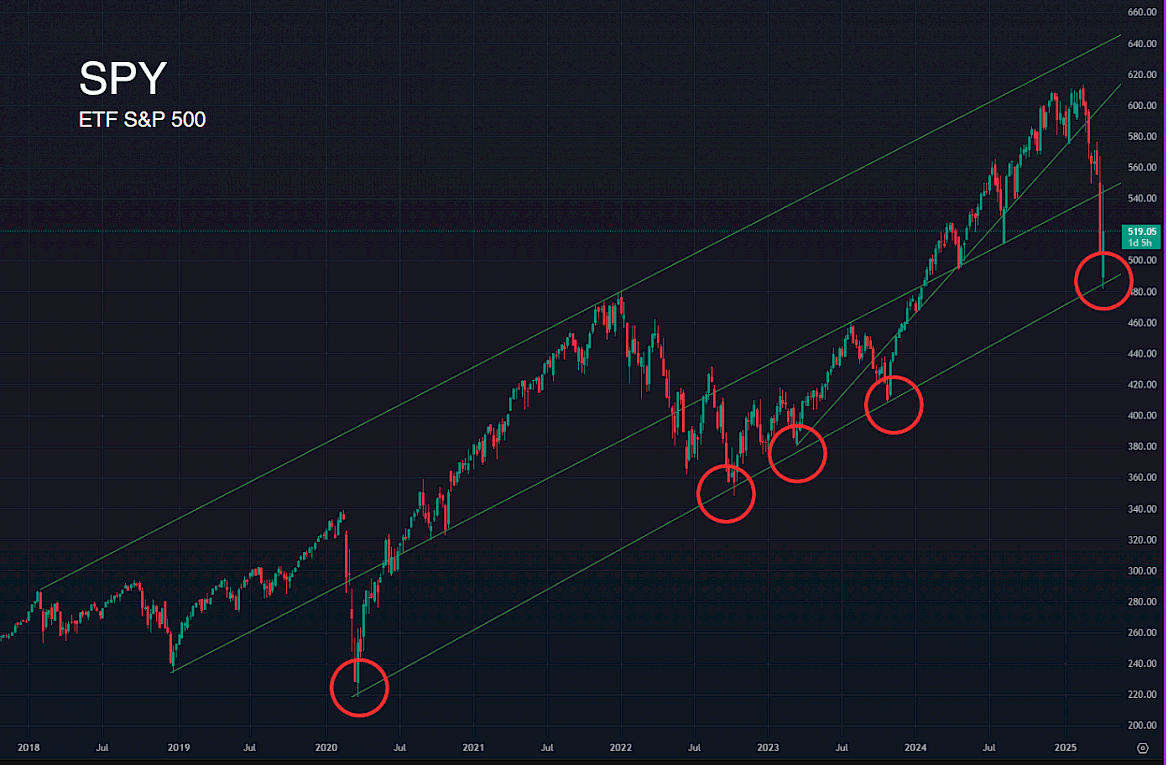
This long-term chart of SPY (ETF for S&P 500) highlights a consistent ascending price channel since 2018. Red circles show repeated bounces off the lower boundary, including the most recent 2025 touch. Historically, each test of this support line has led to a strong rebound, confirming the channel's technical relevance.
We’re closely watching this level—if it holds, it may again act as a launching point. However, if it breaks, a deeper correction could follow.
Note: This article is for informational purposes only and does not constitute an investment recommendation. Investing in the financial markets involves risks and it is important to conduct your own analysis before making an investment decision.